Isabel Ocampo

Strategic Project Management

Portfolio optimisation through reverse-engineered project selection

Strategic Project Management (MSIN0147) · Group coursework · UCL, 2025

Click a page to enlarge.

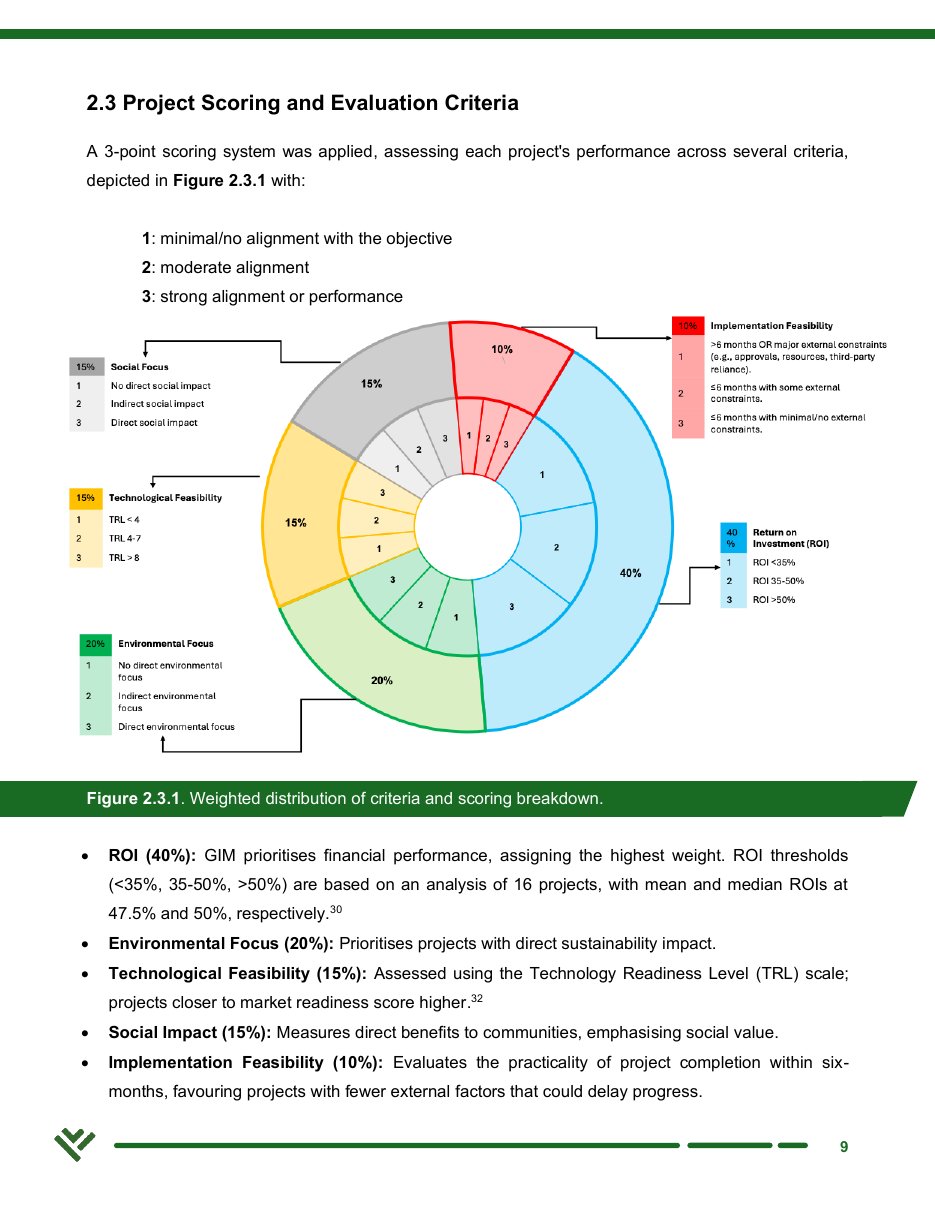
Scoring criteria and weights
Weighted scoring criteria
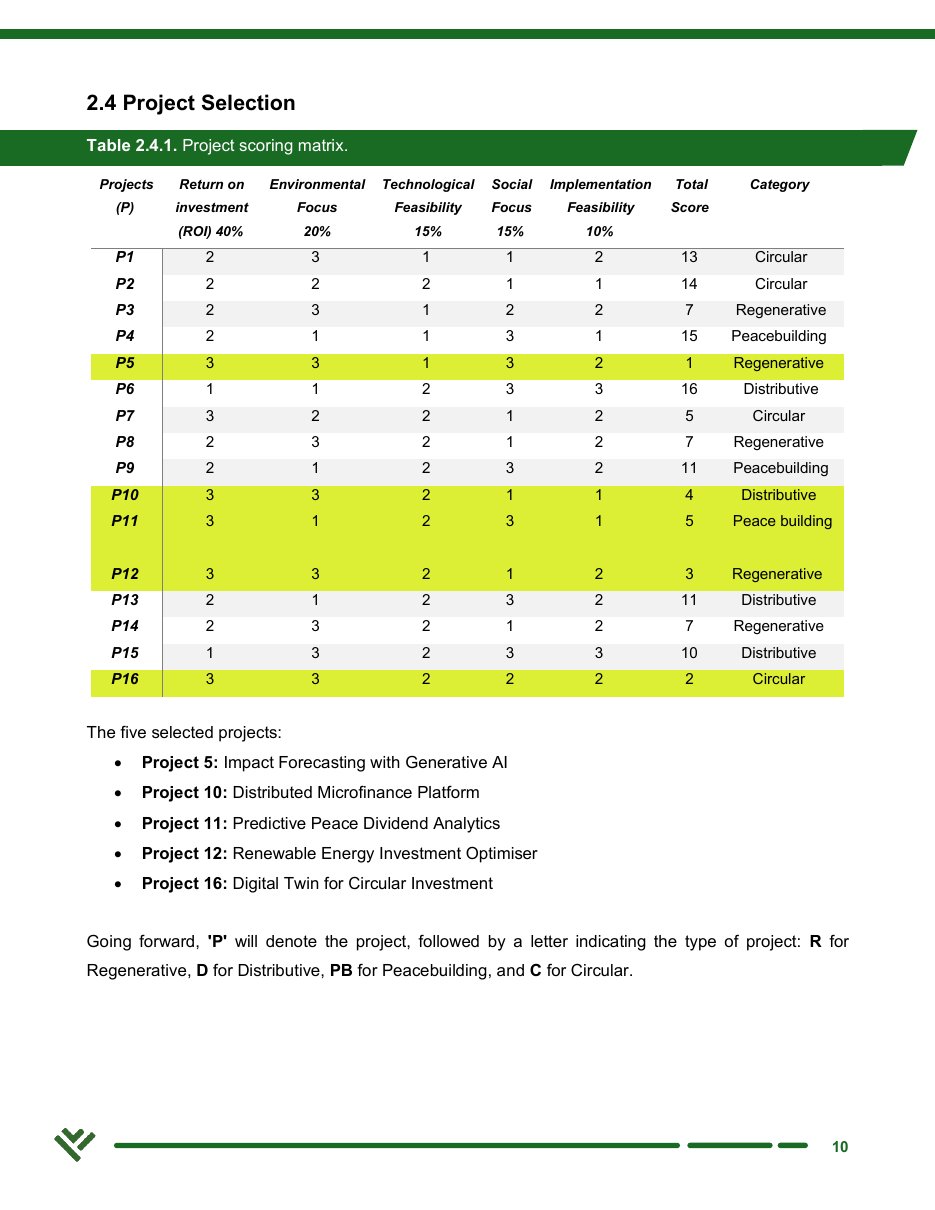
Project scoring matrix with the five selected projects highlighted
Scoring matrix, five selected
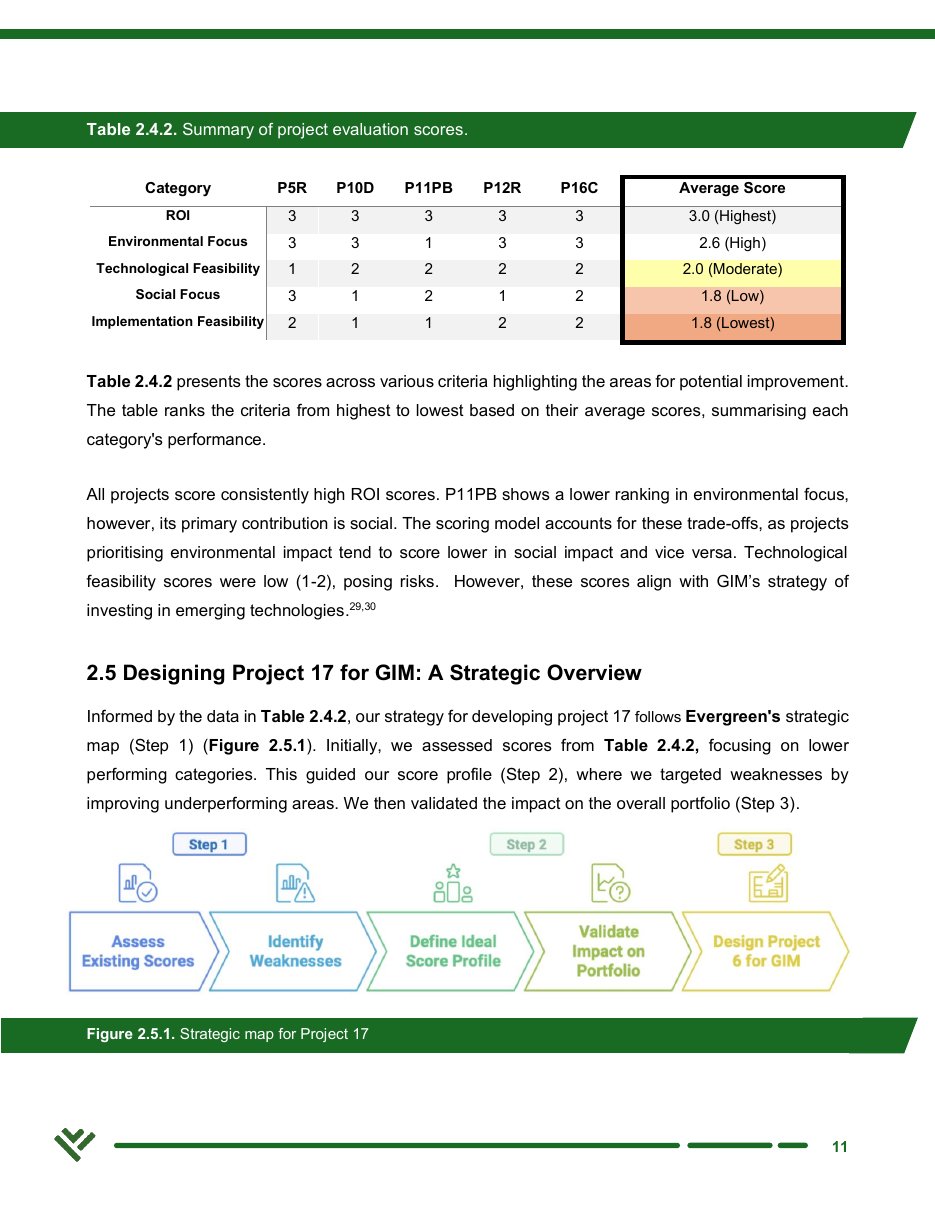
Summary scores and strategic map for the sixth project
Portfolio weaknesses and the strategic map
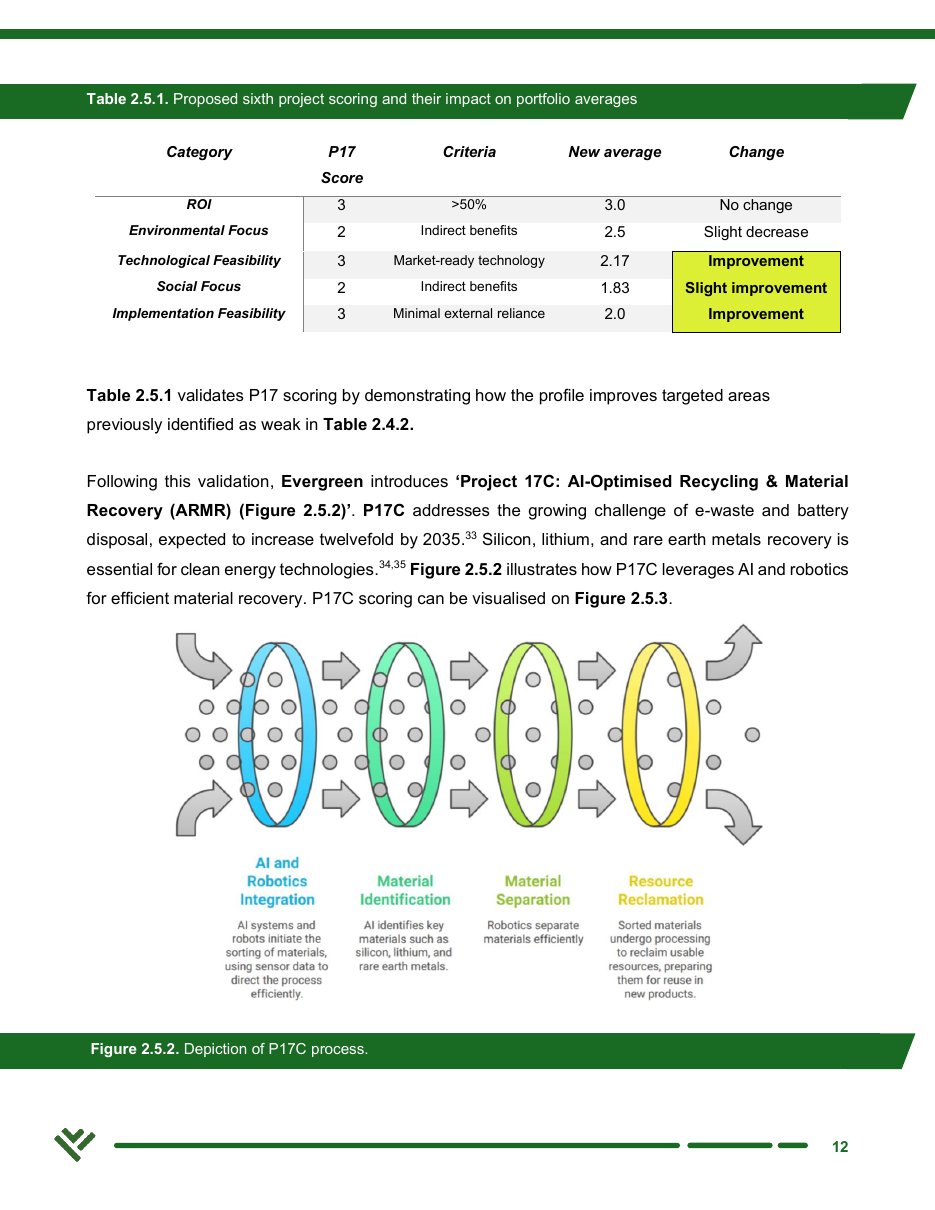
Project 17C scoring and process
Sixth-project evaluation

We developed a weighted scoring model to evaluate 16 proposed sustainable technology investments against financial returns, environmental impact and feasibility criteria.

After selecting five projects, we calculated their average scores to identify weaknesses across the portfolio. Technological feasibility averaged 2.0 out of 3, while social impact and implementation feasibility each averaged 1.8.

We then reverse-engineered the requirements for a sixth project from the existing portfolio's weaknesses. The scoring profile informed the development of an AI-assisted recycling and material recovery proposal, which we evaluated against the original criteria to assess its effect on the portfolio.

The scoring model

Five criteria, weighted to the client's priorities. Each project scores 1 to 3 on each criterion, and the weights turn the five scores into one number.

Return on investment · 40%
Thresholds: under 35%, 35 to 50%, over 50%. Set from the mean and median ROI of the 16 projects (47.5% and 50%).
Environmental focus · 20%
Direct sustainability impact scores highest.
Technological feasibility · 15%
Technology Readiness Level: under 4, 4 to 7, over 8.
Social impact · 15%
Direct benefit to communities.
Implementation feasibility · 10%
Can it be completed in six months with few external constraints.
The matrix as scored in the report. Change a weight and the weighted score and rank update. Reset puts the report's weights back.

ProjectReturn on investment
%
Environmental focus
%
Technological feasibility
%
Social impact
%
Implementation feasibility
%
Weighted scoreRankCategory
P123112Circular
P222211Circular
P323122Regenerative
P421131Peacebuilding
P5
Impact Forecasting with Generative AI
33132Regenerative
P611233Distributive
P732212Circular
P823212Regenerative
P921232Peacebuilding
P10
Distributed Microfinance Platform
33211Distributive
P11
Predictive Peace Dividend Analytics
31231Peacebuilding
P12
Renewable Energy Investment Optimiser
33212Regenerative
P1321232Distributive
P1423212Regenerative
P1513233Distributive
P16
Digital Twin for Circular Investment
33222Circular

Weights must add up to 100. The five highlighted projects are the ones the report selected.

The sixth project

The portfolio's averages before and after adding Project 17C, as published in the report.

CriterionAverage of the fiveProject 17C scoreWhyNew averageChange
Return on investment3.03Over 50%3.0No change
Environmental focus2.62Indirect benefits2.5Slight decrease
Technological feasibility2.03Market-ready technology2.17Improvement
Social impact1.82Indirect benefits1.83Slight improvement
Implementation feasibility1.83Minimal external reliance2.0Improvement

Averages as published in the report, Tables 2.4.2 and 2.5.1.

Risk budget and programme plan

Each project got a weighted probability-and-impact risk score from the project-level threats in the appendix. The £3 million risk budget was shared in proportion to those scores.

  • P5R P/I score 66£546,961
  • P10D P/I score 71£588,398
  • P11PB P/I score 53£439,227
  • P12R P/I score 46£381,215
  • P16C P/I score 67£555,249
  • P17C P/I score 59£488,950
The £3 million risk budget, shared by each project’s weighted probability-and-impact score (Table 4.1.1). Each project also carries a £500,000 management reserve on top of its £2 million base, giving an £18 million programme.
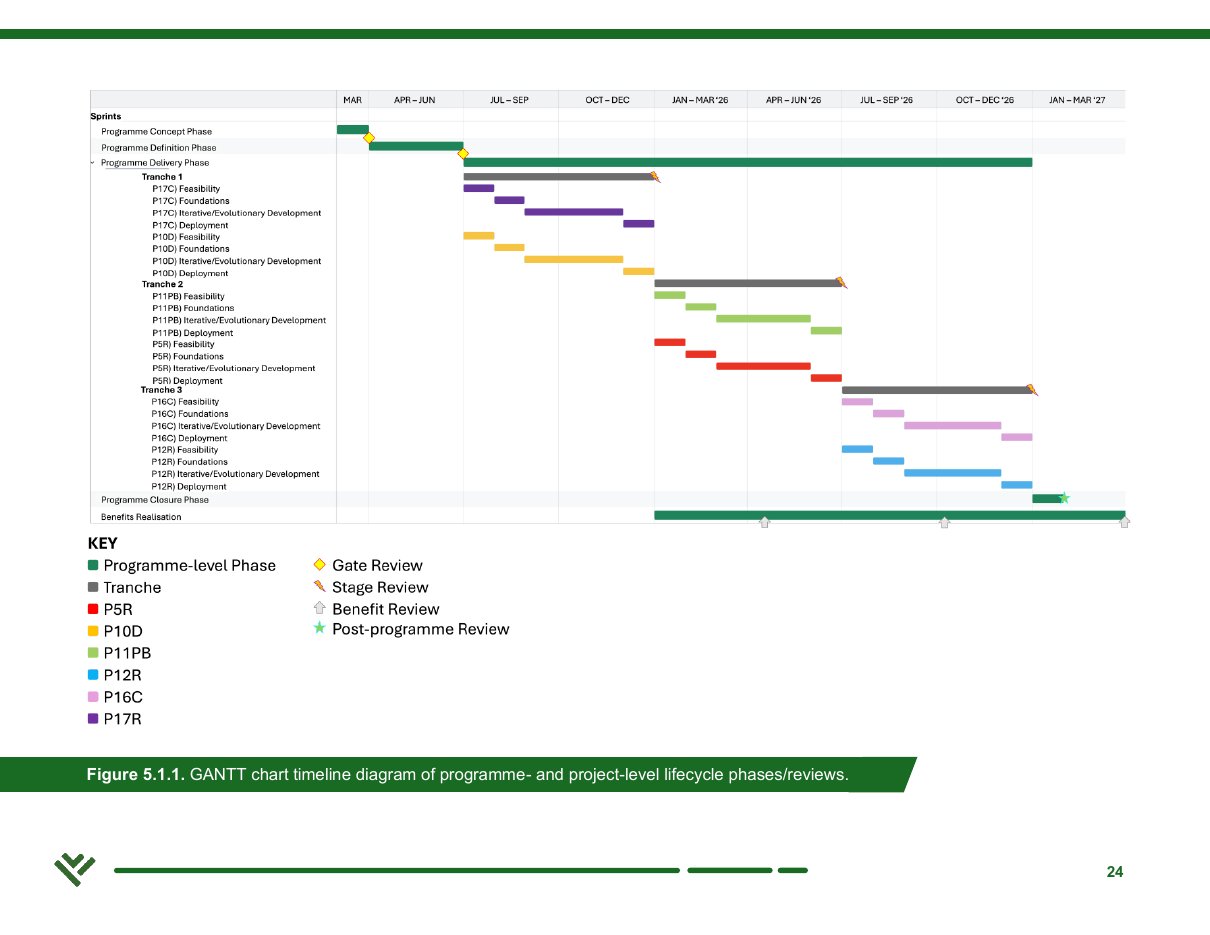
Report page: Gantt chart of programme and project phases
Programme timeline: three tranches with gate reviews.

My part in the group

  • Defining the project-selection criteria and their weights.
  • Building the scoring model used to rank the projects.
  • Allocating the risk budget across the selected projects.
  • Testing how the weaker criteria affected portfolio performance, which led to the sixth-project profile.
  • Documenting the decision logic.

Lecturer feedback